
▶ Read transcript
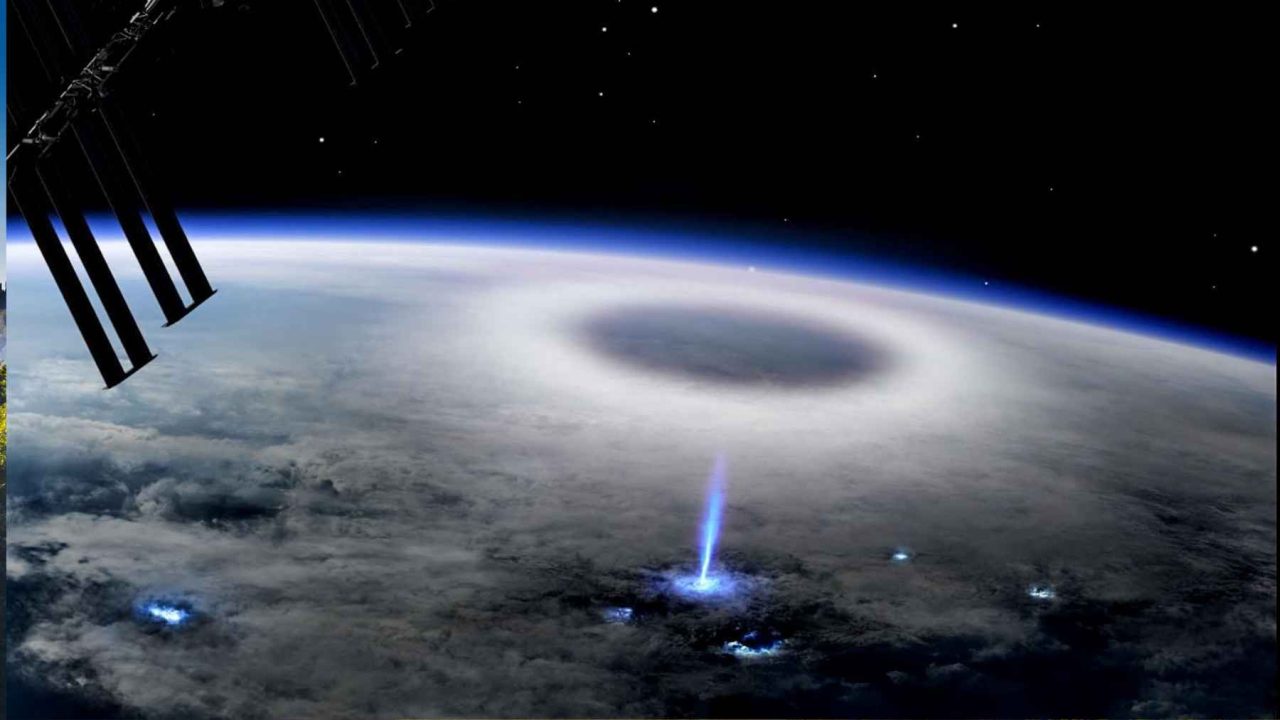
Here’s what you need to know about some fascinating storm discoveries being made from the International Space Station. NASA and its partners have been observing electrical phenomena that explode above thunderstorms from about 249 miles up, including ghostly red sprites, massive expanding rings called ELVES, and blue jets shooting into the stratosphere. These events last only milliseconds and are nearly impossible to see from the ground. A key instrument making this possible is ASIM, a 690-pound monitor installed on the ISS in 2018, equipped with optical, X-ray, and gamma-ray detectors that autonomously capture these fleeting events. The findings have real forecasting implications. Sprite frequency correlates with a storm’s electrical power, potentially flagging severe weather, while ELVES can span 249 miles across and actually disturb the ionosphere, affecting GPS and communications. If you follow weather science, keep an eye on transient luminous events — they’re moving from curiosity to critical forecasting tool.
Everything you think you know about thunderstorms is incomplete. For centuries, we studied storms by looking up. We measured wind speeds, tracked pressure systems, and watched radar screens. But the most revealing clues about extreme weather don’t flash below the clouds. They explode above them.
NASA and its partners have been quietly observing electrical phenomena above thunderstorms from the International Space Station, orbiting roughly 249 miles (400 kilometers) above Earth. What they’ve found, including ghostly red sprites, massive expanding rings called ELVES, and blue jets shooting into the stratosphere, could permanently alter our ability to forecast deadly weather events.
These transient luminous events (TLEs) last only milliseconds. They’re nearly impossible to observe from the ground. And until recently, most meteorologists dismissed them as curiosities rather than critical data points. That era is ending.
Here are the five most significant storm discoveries from the ISS, ranked by their potential to reshape weather science.
| Phenomenon | Altitude | Duration | First Observed | Key Feature |
|---|---|---|---|---|
| Sprites | ~50 miles (80 km) | Milliseconds | 1989 (first footage) | Reddish flashes above storms |
| ELVES | ~60 miles (97 km) | ~1 millisecond | 1990s | Expanding rings ~249 miles wide |
| Blue Jets | Cloud tops to stratosphere | ~200 milliseconds | 1994 | Upward electrical discharges |
| Terrestrial Gamma-Ray Flashes | Storm cloud altitude | Sub-millisecond | 1994 | Gamma radiation from storms |
| Gigantic Jets | Cloud tops to ionosphere | ~1 second | 2001 | Bridge clouds to ionosphere |
Five: ASIM’s 690-Pound Eye on the Storm
Before any of these discoveries could be validated from orbit, NASA and ESA needed the right instrument. In April 2018, the Atmosphere Space Interactions Monitor (ASIM) was installed on the ISS using the station’s roughly 52-foot (16-meter) robotic arm. Weighing about 690 pounds (314 kilograms), it was mounted outside the European Columbus laboratory.
ASIM isn’t just a camera. It carries optical instruments working in infrared and ultraviolet wavelengths, plus X-ray and gamma-ray detectors. Its onboard sensors autonomously decide when to capture and transmit data. This means it can react to millisecond-scale events that no human operator could anticipate.
Ground-based research, including work at Colorado State University, complements what ASIM sees from orbit. But the orbital vantage point is irreplaceable. From the ground, you see the bottom of a storm. From 249 miles up, you see its electrical crown.
Four: Sprites Caught at 50 Miles Above Earth
Sprites are faint reddish flashes that can appear around 50 miles (80 kilometers) above thunderstorms. Pilots reported seeing them for decades, but the scientific community largely ignored the claims. The first credible sprite footage was captured by chance in 1989, when a University of Minnesota research team accidentally recorded one while testing a low-light camera.
Since then, sprites have moved from folklore to frontier science. From the ISS, ASIM has captured sprites in unprecedented detail, revealing their internal structure. They’re not simple flashes. They branch downward in tendrils, resembling inverted lightning bolts made of ionized gas.
“Transient luminous events often last only milliseconds, making them extremely difficult to observe from the ground.”
— NASA ISS Research Overview
Why does this matter for forecasting? Sprite frequency and intensity correlate with the electrical power of the parent thunderstorm. A storm producing abundant sprites may be generating exceptionally strong positive lightning discharges, the kind associated with severe hail, tornadoes, and damaging winds. If meteorologists can detect sprite signatures remotely, they gain a new proxy for storm severity.
Three: ELVES Spanning 249 Miles Across
ELVES (Emission of Light and Very Low Frequency perturbations due to Electromagnetic Pulse Sources) are perhaps the most visually stunning TLEs. They appear as dim, expanding rings that may span about 249 miles (400 kilometers) across. They last roughly one millisecond. Blink and you’ll miss them by a factor of several hundred.
From the ISS, ASIM has confirmed that lightning-like discharges near storm tops can trigger ELVES and influence the ionosphere. This is a critical finding. The ionosphere is the layer of Earth’s atmosphere that reflects radio waves and affects GPS signals, satellite communications, and aviation navigation.
If a single thunderstorm can perturb the ionosphere across a 249-mile diameter, the implications are enormous. Severe storm systems could disrupt communications infrastructure in ways we haven’t accounted for. Tracking ELVES from space could provide early warnings not just for weather damage on the ground, but for communication blackouts and navigation errors in the air.
Two: Blue Jets Bridging Clouds and the Stratosphere
Blue jets are electrical discharges that shoot upward from cloud tops into the stratosphere. Unlike sprites, which form high above the storm and cascade downward, blue jets originate at the storm itself and punch upward. ESA describes them as cone-shaped bursts of blue light, lasting a fraction of a second.
In 2019, ASIM captured a blue jet event in remarkable detail, revealing that these discharges begin with an intense electrical breakdown near the cloud top. The observation showed the jet emerging from a narrow channel before expanding into a broader cone as it climbed into thinner atmosphere.
This discovery has profound implications. If thunderstorms routinely inject electrical energy into the stratosphere via blue jets, they may be influencing ozone concentrations on a scale we haven’t measured. Climate models that ignore this vertical electrical transport could be underestimating the atmospheric impact of intense storm systems.
For weather prediction, blue jets offer another signal. Their presence indicates extreme electrical activity within a storm cell. Detecting them from orbit could help forecasters identify the most dangerous storms in real time, even over remote oceans where ground-based radar doesn’t reach.
You’re a meteorologist responsible for issuing severe storm warnings over the open Atlantic, where radar coverage is minimal. A new satellite system offers real-time transient luminous event (TLE) data from orbit, but it hasn’t been fully validated against ground-truth measurements. A developing storm system shows high sprite and ELVES activity.
One: The Ionosphere Connection That Changes Everything
The most significant finding from the ISS storm observations isn’t any single phenomenon. It’s the confirmation that thunderstorms directly couple with the ionosphere through TLEs. This connection, long theorized but never conclusively demonstrated, has now been documented through years of ASIM data.
Here’s why this ranks first. Traditional weather forecasting treats the troposphere (where weather happens) and the ionosphere (60+ miles up) as essentially separate systems. Meteorologists model storm behavior using surface pressure, humidity, wind shear, and temperature profiles. The ionosphere belongs to space weather scientists tracking solar activity and geomagnetic disturbances.
ASIM’s observations prove these domains are linked through electrical pathways. When a powerful thunderstorm generates sprites, blue jets, and ELVES, it’s not just putting on a light show. It’s pumping energy into the upper atmosphere, modifying the ionosphere’s electron density, and potentially creating feedback loops that influence the storm itself.
Consider the practical applications. A future weather satellite constellation equipped with TLE detectors could monitor every thunderstorm on Earth simultaneously. By tracking sprite frequency, ELVES intensity, and blue jet occurrence, forecasters could rate storm severity in real time without relying on ground-based radar.
This would be transformative for regions with sparse radar coverage: the open ocean, sub-Saharan Africa, Southeast Asia, and the Arctic. Currently, these areas have significant gaps in severe weather monitoring. Orbital TLE detection could fill those gaps.
The research pipeline is already building. Ground-based teams at institutions like Colorado State University are correlating ISS observations with surface weather data. NASA’s Earth observation programs from the ISS have produced hundreds of thousands of images, recording phenomena such as storms in real time.
NASA astronauts continue to contribute as well. Station crew members have captured stunning imagery and video of lightning storms from orbit, providing visual context that complements ASIM’s instrument data. This combination of human observation and autonomous sensing creates a uniquely rich dataset.
Why This Ranking Redefines Storm Science
The order of this countdown reflects a progression from tool to insight. ASIM (number five) is the foundation, the instrument that made everything possible. Sprites (four) and ELVES (three) demonstrated that individual TLEs carry meaningful information about storm intensity. Blue jets (two) revealed that storms transport energy vertically in ways we hadn’t measured.
And the ionosphere connection (number one) ties it all together into a unified framework. Storms aren’t isolated tropospheric events. They’re electrical engines with exhaust pipes reaching 60 miles into the sky.
For anyone who watches weather forecasts and wonders why they still get it wrong, this research offers a partial answer. We’ve been modeling half the storm. The upper half, the part that shoots red tendrils into the mesosphere and rings the ionosphere like a bell, has been invisible to our prediction systems.
That’s changing now, 249 miles above your head, one millisecond flash at a time.

Leave a Reply