

▶ Read transcript
Here’s what you need to know about a striking new finding from satellite data that could reshape farming worldwide. Between 2010 and 2020, the vegetation center of the Southern Hemisphere’s summer peak drifted northward at roughly 8.7 miles per year, nearly six times faster than the long-term average. Lead researcher Miguel Mahecha called this acceleration a huge surprise. Meanwhile, in the Northern Hemisphere, warmer winters are extending growing seasons, making previously marginal land in places like Canada and Scandinavia viable for crops. The shift isn’t only northward either. Massive greening efforts in India and China are pulling Earth’s vegetation center eastward, meaning agricultural planning models based on static vegetation zones are already outdated. The key takeaway: if you’re involved in farming, food policy, or land use planning, start incorporating satellite vegetation data into your decision-making now, because the zones that have been productive for centuries are actively shifting.
Between 2010 and 2020, the vegetation center of the Southern Hemisphere’s summer peak drifted northward at roughly 8.7 miles per year. That’s nearly six times faster than the long-term average. Lead author Miguel Mahecha called this acceleration “a huge surprise,” and the data behind it could rewrite agricultural planning for countries spanning three continents.
Satellites have tracked Earth’s greenness for decades using leaf area index measurements. What they’ve found recently isn’t just a subtle trend. It’s a dramatic, accelerating redistribution of where plants grow, when they grow, and how long they stay green. For farmers, policymakers, and food systems worldwide, the countdown to adaptation has already begun.
How Scientists Track the Planet’s ‘Green Center of Mass’
Think of the green center of mass like a balance point for all of Earth’s vegetation. Researchers use satellite-derived leaf area index data to calculate where this center sits at any given time. It shifts with the seasons, swinging between hemispheres as summer greening pulses north and south.
At its northernmost position, the green center reaches a point near Iceland in the North Atlantic around mid-July. At its southernmost, it sits off the coast of Liberia around March. Both extremes fall in the Northern Hemisphere, reflecting the simple fact that most of Earth’s landmass sits north of the equator.
| Metric | Long-Term Average | 2010–2020 Rate | Acceleration Factor |
|---|---|---|---|
| NH Summer Peak Drift (northward) | ~1.2 mi/yr (2.0 km/yr) | ~2.1 mi/yr (3.3 km/yr) | 1.75× |
| SH Summer Peak Drift (northward) | ~1.5 mi/yr (2.4 km/yr) | ~8.7 mi/yr (14.0 km/yr) | 5.8× |
Instruments like the NOAA polar-orbiting satellites and Landsat’s Normalized Difference Vegetation Index (NDVI) provide the raw measurements. More recently, NASA’s PACE satellite has begun observing plant pigments, including chlorophylls, carotenoids, and anthocyanins, from orbit. These tools collectively paint a picture of a planet whose vegetation geography is in flux.
Five Satellite Findings That Could Reshape Agriculture
Five: Warmer Winters Are Extending Growing Seasons in the North
Warmer winters and longer growing seasons in the Northern Hemisphere are keeping vegetation greener for longer periods. This persistent greenness tugs the global center of mass northward year-round, not just during summer peaks.
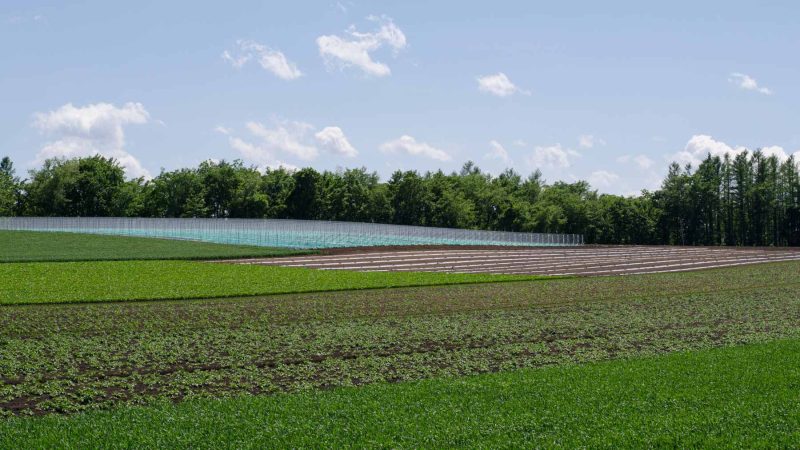
For countries like Canada, Scandinavia, and northern Russia, this means previously marginal land is becoming viable for crops. Regions that once supported only a few months of growth may soon sustain full agricultural cycles. The satellite record shows this isn’t speculation; it’s already happening.
But longer growing seasons come with trade-offs. Pest ranges expand. Water demands shift. Soil that was frozen for millennia begins to thaw and release carbon. The greening signal is real, but the agricultural opportunity it represents is deeply conditional.
Four: The Southern Hemisphere’s Vegetation Shift Is Accelerating Dramatically
The most startling number in the entire study belongs to the Southern Hemisphere. Between 2010 and 2020, its summer peak drifted northward at about 8.7 miles per year. That’s nearly six times faster than the long-term rate of 1.5 miles per year.
Mahecha described this finding as “a huge surprise.” The implications ripple through tropical and subtropical agriculture. If vegetation productivity is shifting northward even in the Southern Hemisphere, it suggests that equatorial and sub-Saharan regions may be losing relative greenness while areas closer to the tropics of the Northern Hemisphere gain it.
Countries in West Africa, South America, and Southeast Asia should pay close attention. Agricultural zones that have been productive for centuries may need new crop varieties, irrigation strategies, or land-use plans within the next two decades.
Three: Greening Hotspots in India and China Are Pulling the Center East
The drift isn’t just northward. The study detects a clear eastward component. Greening hotspots in India, China, and Russia are suspected of pulling the green center of mass toward the east.
India’s aggressive reforestation campaigns and China’s massive afforestation programs have added billions of trees over the past two decades. These aren’t just environmental gestures. They’re measurable, satellite-visible shifts in where Earth’s vegetation concentrates. Russia’s boreal forests, meanwhile, are expanding as permafrost retreats and temperatures rise.
For Indian and Chinese agriculture, this eastward pull represents both validation and warning. Their greening efforts are working at a planetary scale. But the same warming that enables this greening also introduces new drought patterns, monsoon variability, and heat stress for staple crops.
Two: Satellite Carbon Tracking Reveals Where Future Farmland Gains Matter Most
Satellites don’t just measure greenness. They estimate carbon uptake by vegetation, which directly correlates with agricultural productivity potential. EUMETSAT data confirms that these measurements are essential for estimating long-term global carbon sequestration.
When vegetation shifts northward, carbon uptake shifts with it. Northern soils that were carbon-poor begin to accumulate organic matter. Southern soils that were carbon-rich may begin to lose it. This redistribution affects soil fertility, water retention, and crop yields in ways that traditional ground-based monitoring simply cannot capture at scale.
A NOAA study using long-term vegetation data sets derived from polar-orbiting satellites found significant greening across Earth’s vegetative areas. This greening isn’t uniform. It clusters in specific regions, creating winners and losers in the global agricultural landscape.
“The northward shift of the Southern Hemisphere summer peak was a huge surprise.”
— Miguel Mahecha, Lead Author
For agricultural planners, satellite-derived carbon uptake maps are becoming as important as rainfall data. They reveal not just where plants are growing now, but where productive farmland is emerging and where it’s declining.
You’re an agricultural policy advisor for a Southern Hemisphere country. Satellite data shows your region’s vegetation productivity is declining as the green center of mass drifts northward at 8.7 miles per year. You have limited budget for the next decade.
The Accelerating Northward Drift Between 2010 and 2020 Changes Everything
Here’s the finding that sits at the top of this countdown, and it’s not a single number. It’s the convergence of every trend listed above into one undeniable pattern: the acceleration.
The long-term northward drift of about 1.2 miles per year at the Northern Hemisphere summer peak nearly doubled to 2.1 miles per year between 2010 and 2020. The Southern Hemisphere’s drift didn’t just double. It multiplied nearly sixfold, from 1.5 to 8.7 miles per year.
This acceleration matters because agricultural systems are built on assumptions of stability. Crop insurance models, irrigation infrastructure, seed selection, planting calendars: all of these assume that the zones where crops thrive will remain roughly constant from decade to decade. The satellite data says otherwise.
Consider what 8.7 miles per year means over 30 years: a shift of roughly 260 miles. That’s the distance from London to Paris. Or from Dallas to Houston. Entire agricultural belts could migrate that far within a single generation.
The eastward component adds another dimension. Vegetation isn’t just moving north; it’s concentrating in specific longitudinal bands, particularly across South and East Asia. Countries that sit in these greening corridors, like India, China, and parts of Russia, have a strategic advantage. Countries that sit outside them face a different calculus entirely.
For nations in sub-Saharan Africa, the data carries urgency. If the Southern Hemisphere’s green center is racing northward, equatorial and southern African agricultural zones may face declining vegetation productivity. This isn’t a 2050 problem. At 8.7 miles per year, it’s a problem that’s compounding right now.
Why the Order of These Findings Matters for Policy
Each item in this countdown builds on the last. Longer growing seasons create the conditions for northward drift. The Southern Hemisphere’s dramatic acceleration reveals that this isn’t a gentle, linear process. The eastward pull from India, China, and Russia shows that human land-use decisions interact with climate forces. And the carbon tracking data provides the economic framework for understanding who gains and who loses.
Together, they form a single message: the geography of global agriculture is shifting faster than most planning frameworks assume. Satellite data now provides the resolution and temporal depth to track these changes in near real-time. The question is whether governments and agricultural institutions will use it.
Countries that integrate satellite vegetation monitoring into their agricultural policy, adjusting crop zones, investing in new varieties, and updating infrastructure, will adapt. Countries that treat their current agricultural geography as permanent will be caught off guard by a planet that has already moved on.
The green center of mass doesn’t care about national borders, trade agreements, or five-year plans. It follows physics, photosynthesis, and a warming atmosphere. And right now, it’s heading northeast at a pace that would have seemed impossible a decade ago.


Leave a Reply