
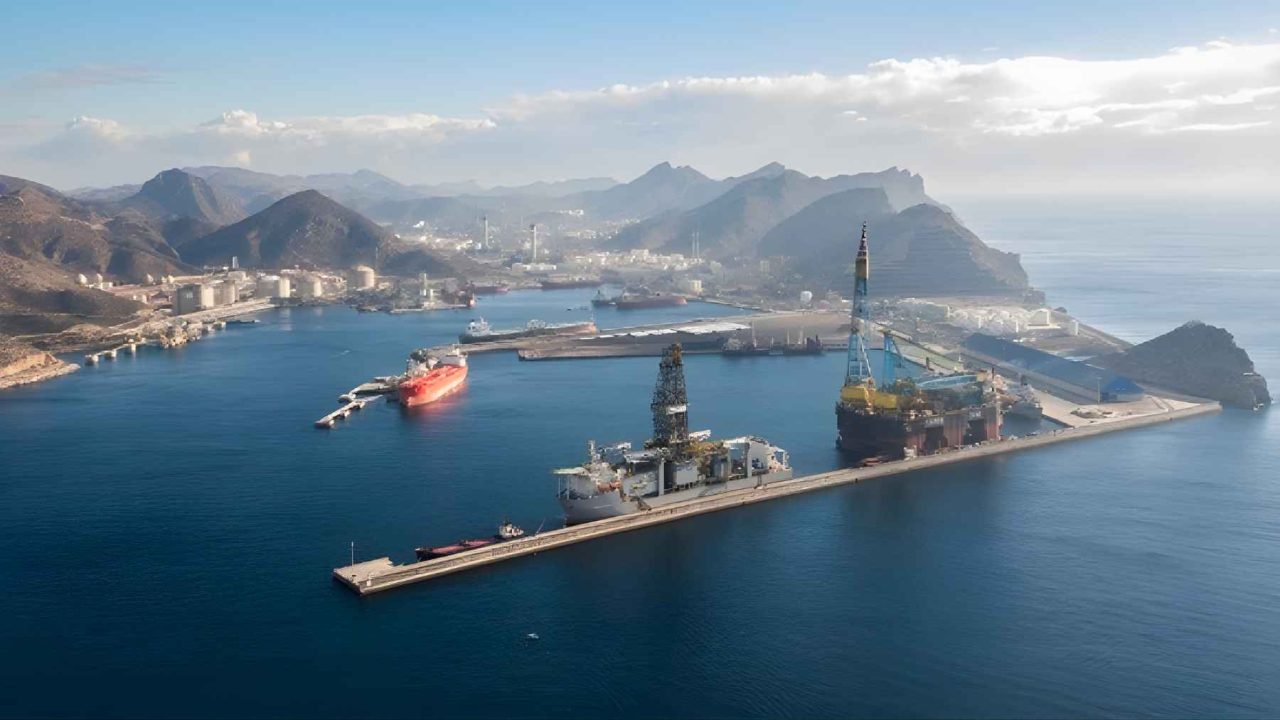
Ninety-five ships. That was the daily rhythm of the Strait of Hormuz as recently as early 2025 — a relentless maritime heartbeat keeping the world’s energy economy alive. Now that number has collapsed to fewer than ten ships a day. The question splitting energy analysts, geopolitical strategists, and ordinary consumers is whether this is a temporary shock or the opening act of a genuine global crisis.
The Strait of Hormuz sits between Iran and Oman, roughly 21 miles wide at its narrowest navigable channel. Through it flowed an average of 20 million barrels of oil every single day in 2024. That figure represents approximately one-fifth of all the oil consumed on Earth. The strait also carries about 19 percent of the world’s traded liquefied natural gas, mostly exported from Qatar and the United Arab Emirates.
When 55 of those daily 95 ships were oil tankers, the math was straightforward. Now, with traffic below 10 vessels a day, the arithmetic has turned alarming.
The 95-to-10 Collapse: What Triggered Hormuz’s Sudden Shutdown
The Strait of Hormuz has long been called the world’s most critical oil chokepoint. But that description can feel abstract until you watch the traffic data collapse in real time. The IMF’s PortWatch platform, built as a joint initiative with the University of Oxford and Delft University of Technology, was designed precisely for this purpose — tracking global maritime traffic to catch supply chain shocks before they become consumer crises.
PortWatch data showed the collapse was not gradual. It was sudden. When conflict escalated in the region, maritime insurers pulled back war-risk coverage almost immediately. Without insurance, ship operators could not justify sending vessels into the strait. The route became financially impassable before it became physically unnavigable.
That distinction matters enormously. This is not a blockade enforced by guns alone. It is a blockade enforced by actuarial tables.
Position A: Why Fewer Than 10 Ships a Day Signals a True Energy Crisis
Analysts arguing for the crisis position start with a simple, uncomfortable fact. There is no adequate alternative to the Strait of Hormuz at current volume. The Suez Canal handles different trade flows. Overland pipelines from the Gulf region exist but carry only a fraction of what Hormuz moves. Saudi Arabia’s East-West Pipeline, for example, has a capacity of roughly 5 million barrels per day — just one quarter of Hormuz’s normal throughput.
The LNG situation is arguably more acute. Qatar is the world’s largest LNG exporter. Most of its export terminals face the Persian Gulf, meaning the gas must pass through Hormuz to reach European and Asian buyers. There is no pipe-and-forget alternative for LNG the way there is for crude oil in some corridors.
Energy markets respond to anticipated shortages, not just current ones. Even a two-week disruption to 20 million barrels of daily oil flow sends price signals cascading through fertilizer costs, plastics manufacturing, airline tickets, and home heating bills. The people who feel this fastest are not oil executives. They are farmers in South Asia buying diesel for irrigation pumps and families in Northern Europe facing winter heating bills.
| Alternative Route or Option | Max Capacity (barrels/day) | Fills the Hormuz Gap? |
|---|---|---|
| Saudi East-West Pipeline | ~5 million | No — covers 25% of Hormuz volume |
| UAE Habshan-Fujairah Pipeline | ~1.5 million | No — covers 7.5% of Hormuz volume |
| IEA Strategic Petroleum Reserves | ~1.2 billion barrels total | Partial — buys roughly 60 days |
| Rerouting via Cape of Good Hope | Theoretically unlimited | Partial — adds 10 or more days, higher cost |
Position B: Why Global Energy Markets Have More Shock Absorbers Than 1973
The counterargument is not that this disruption is painless. It is that modern energy markets have built-in buffers that did not exist during the oil crises of the 1970s. The International Energy Agency coordinates strategic petroleum reserves across member countries. A coordinated release can inject hundreds of millions of barrels into global markets within weeks of a decision.
Global oil production is also far more geographically distributed than it was in past crises. The United States now produces over 13 million barrels per day, making it the world’s largest producer. Canada, Brazil, Norway, and Guyana have all expanded output significantly in recent years. These producers can reroute supply to Asia and Europe faster than they could a decade ago, because the export infrastructure now exists.
Some analysts also note that the conflict disrupting Hormuz damages producers inside the Gulf as severely as consumers outside it. Saudi Arabia, Kuwait, Iraq, and the UAE depend on Hormuz access to generate government revenue that funds their entire national economies. That mutual vulnerability creates strong incentives for rapid diplomatic resolution.
“The Strait of Hormuz is the world’s most important oil chokepoint. Any serious disruption to oil flows through this strait could have a significant impact on global oil prices and supply.”
— U.S. Energy Information Administration
What PortWatch Data Actually Shows About Chokepoint Disruptions
PortWatch has tracked previous chokepoint disruptions in real time. When Houthi attacks in the Red Sea drove shipping away from the Suez Canal in late 2023 and through 2024, PortWatch documented how rerouting via the Cape of Good Hope added significant time and cost to global supply chains. Shipping rates spiked. Delivery windows stretched by weeks.
The Hormuz situation differs in one critical respect. The Suez Canal carries enormous volumes of container goods and some energy cargo. Hormuz carries energy almost exclusively. When container ships reroute around Africa, consumer goods get delayed. When oil tankers cannot pass Hormuz, energy supply physically disappears from markets with no comparable backup source nearby.
The data also shows that insurance-driven shutdowns tend to outlast military-driven ones. When a threat can be physically neutralized, shipping resumes quickly. When the threat remains ambiguous and insurers manage long-tail actuarial risk, coverage stays withdrawn for weeks or months after the immediate danger has passed.
The Verdict: Why Geography Cannot Be Negotiated Away
Both positions in this debate have merit. Markets are more resilient than they were in 1973. Strategic reserves exist. Non-Gulf oil production has genuinely diversified. These buffers are real.
But the optimistic position ultimately rests on a timeline assumption: that diplomatic resolution arrives before reserves run thin and rerouting capacity gets stretched to its limit. If the traffic collapse at Hormuz lasts more than three to four weeks at current levels, the buffers begin to degrade. After six weeks, energy prices in import-dependent economies move in ways that directly affect food costs, industrial output, and household budgets.
The LNG dimension is particularly underappreciated in public coverage. Europe spent years after 2022 scrambling to replace Russian pipeline gas with Qatari LNG. If Qatari LNG cannot exit the Persian Gulf, Europe faces a second gas supply crisis before it has fully recovered from the first. That is not a tail risk scenario. It is a near-term supply arithmetic problem.
What a Prolonged Hormuz Closure Reveals About Energy Policy After 2026
The deeper implication of this crisis is what it exposes about the fragility built into the global energy architecture. For decades, the world has tolerated extreme geographic concentration of oil and gas supply because the price was low and the political risk seemed manageable.
A drop from 95 ships to fewer than 10 in a matter of days demonstrates that the so-called manageable risk was never truly managed. It was deferred. Every serious energy policy conversation after this event will need a realistic answer to a simple question: what does the world actually do when Hormuz closes?
Renewable energy advocates will argue this vindicates accelerating the clean energy transition. They are not wrong — but solar panels and wind turbines do not replace petrochemical feedstocks, aviation fuel, or heavy shipping fuel on a five-year timeline. The honest answer is that the world needs both a faster transition and a far more geographically distributed fossil fuel supply chain for the decade in between.
Ninety-five ships reduced to fewer than ten. One number reveals everything about how close the global energy system operates to its own margin of failure.
Frequently Asked Questions

You Might Also Like
Saudi Arabia’s Desert River Runs on 264 Million Gallons of Sewage
Riyadh turned 264 million gallons of daily wastewater into a 120km desert river. Here's the…
The Alien Comet That Broke the Internet and Fooled AI
Interstellar comet 3I/ATLAS entered our solar system — and the social media frenzy caused AI…

The Iberian Peninsula Is Slowly Spinning, and It Changes Everything
Geologists confirm Spain and Portugal are rotating clockwise due to Africa-Eurasia collision. New study rewrites…
Leave a Reply